Online shopping Statistics 2024 continues its expansion, with global e-commerce sales projected to reach $6.33 trillion by 2024 year’s end.
While growth rates have moderated compared to the pandemic-driven surge, the sector maintains steady progress with an expected 7-9% growth in online and non-store sales in the US alone.
Despite this digital transformation, physical stores still command approximately 70% of total retail sales, highlighting the enduring importance of traditional retail alongside the rising e-commerce tide.
This article also covers global e-commerce trends, demographic shopping patterns, country-specific data, mobile commerce statistics, in-store versus online comparisons, market leaders, and revenue projections.
Online Shopping Statistics 2025: Key Insights
- 43% of women and 32% of men often shop at big online stores
- 62.9% of women and 60% of men who shop online like to buy directly from the store’s website or app.
- 94% of women (between 15 and 35) spend more than an hour every day shopping online.
(Capital One Shopping Research - In the second quarter of 2024, Smartphones accounted for 77% of retail website visits worldwide, yet only 67% of orders were placed via smartphones
- While desktops generated just 21% of visits and a higher share of 32% of orders, tablets contributed 2% to traffic and 1% to orders.
(Statista)
- 58% of shoppers in the USA cited convenience as the primary reason for shopping online, highlighting the ease and accessibility of online retail. (Marist Poll)
- 64.3% of consumers concerned about contracting COVID-19 and 56.4% worried about food shortages were more likely to shop online in 2022. (Cambridge)
Online Shopping Statistics Worldwide
- 2.64 billion people worldwide shopped online, of which 10% were Americans in 2023.
- Global online shopping generated $5.82 trillion in 2023. From 2023 to 2030, online shopping is projected to grow at an average yearly rate of 7.40%, with online sales expected to represent 25.3% of global retail sales by 2030.
(Capital One Shopping Research)
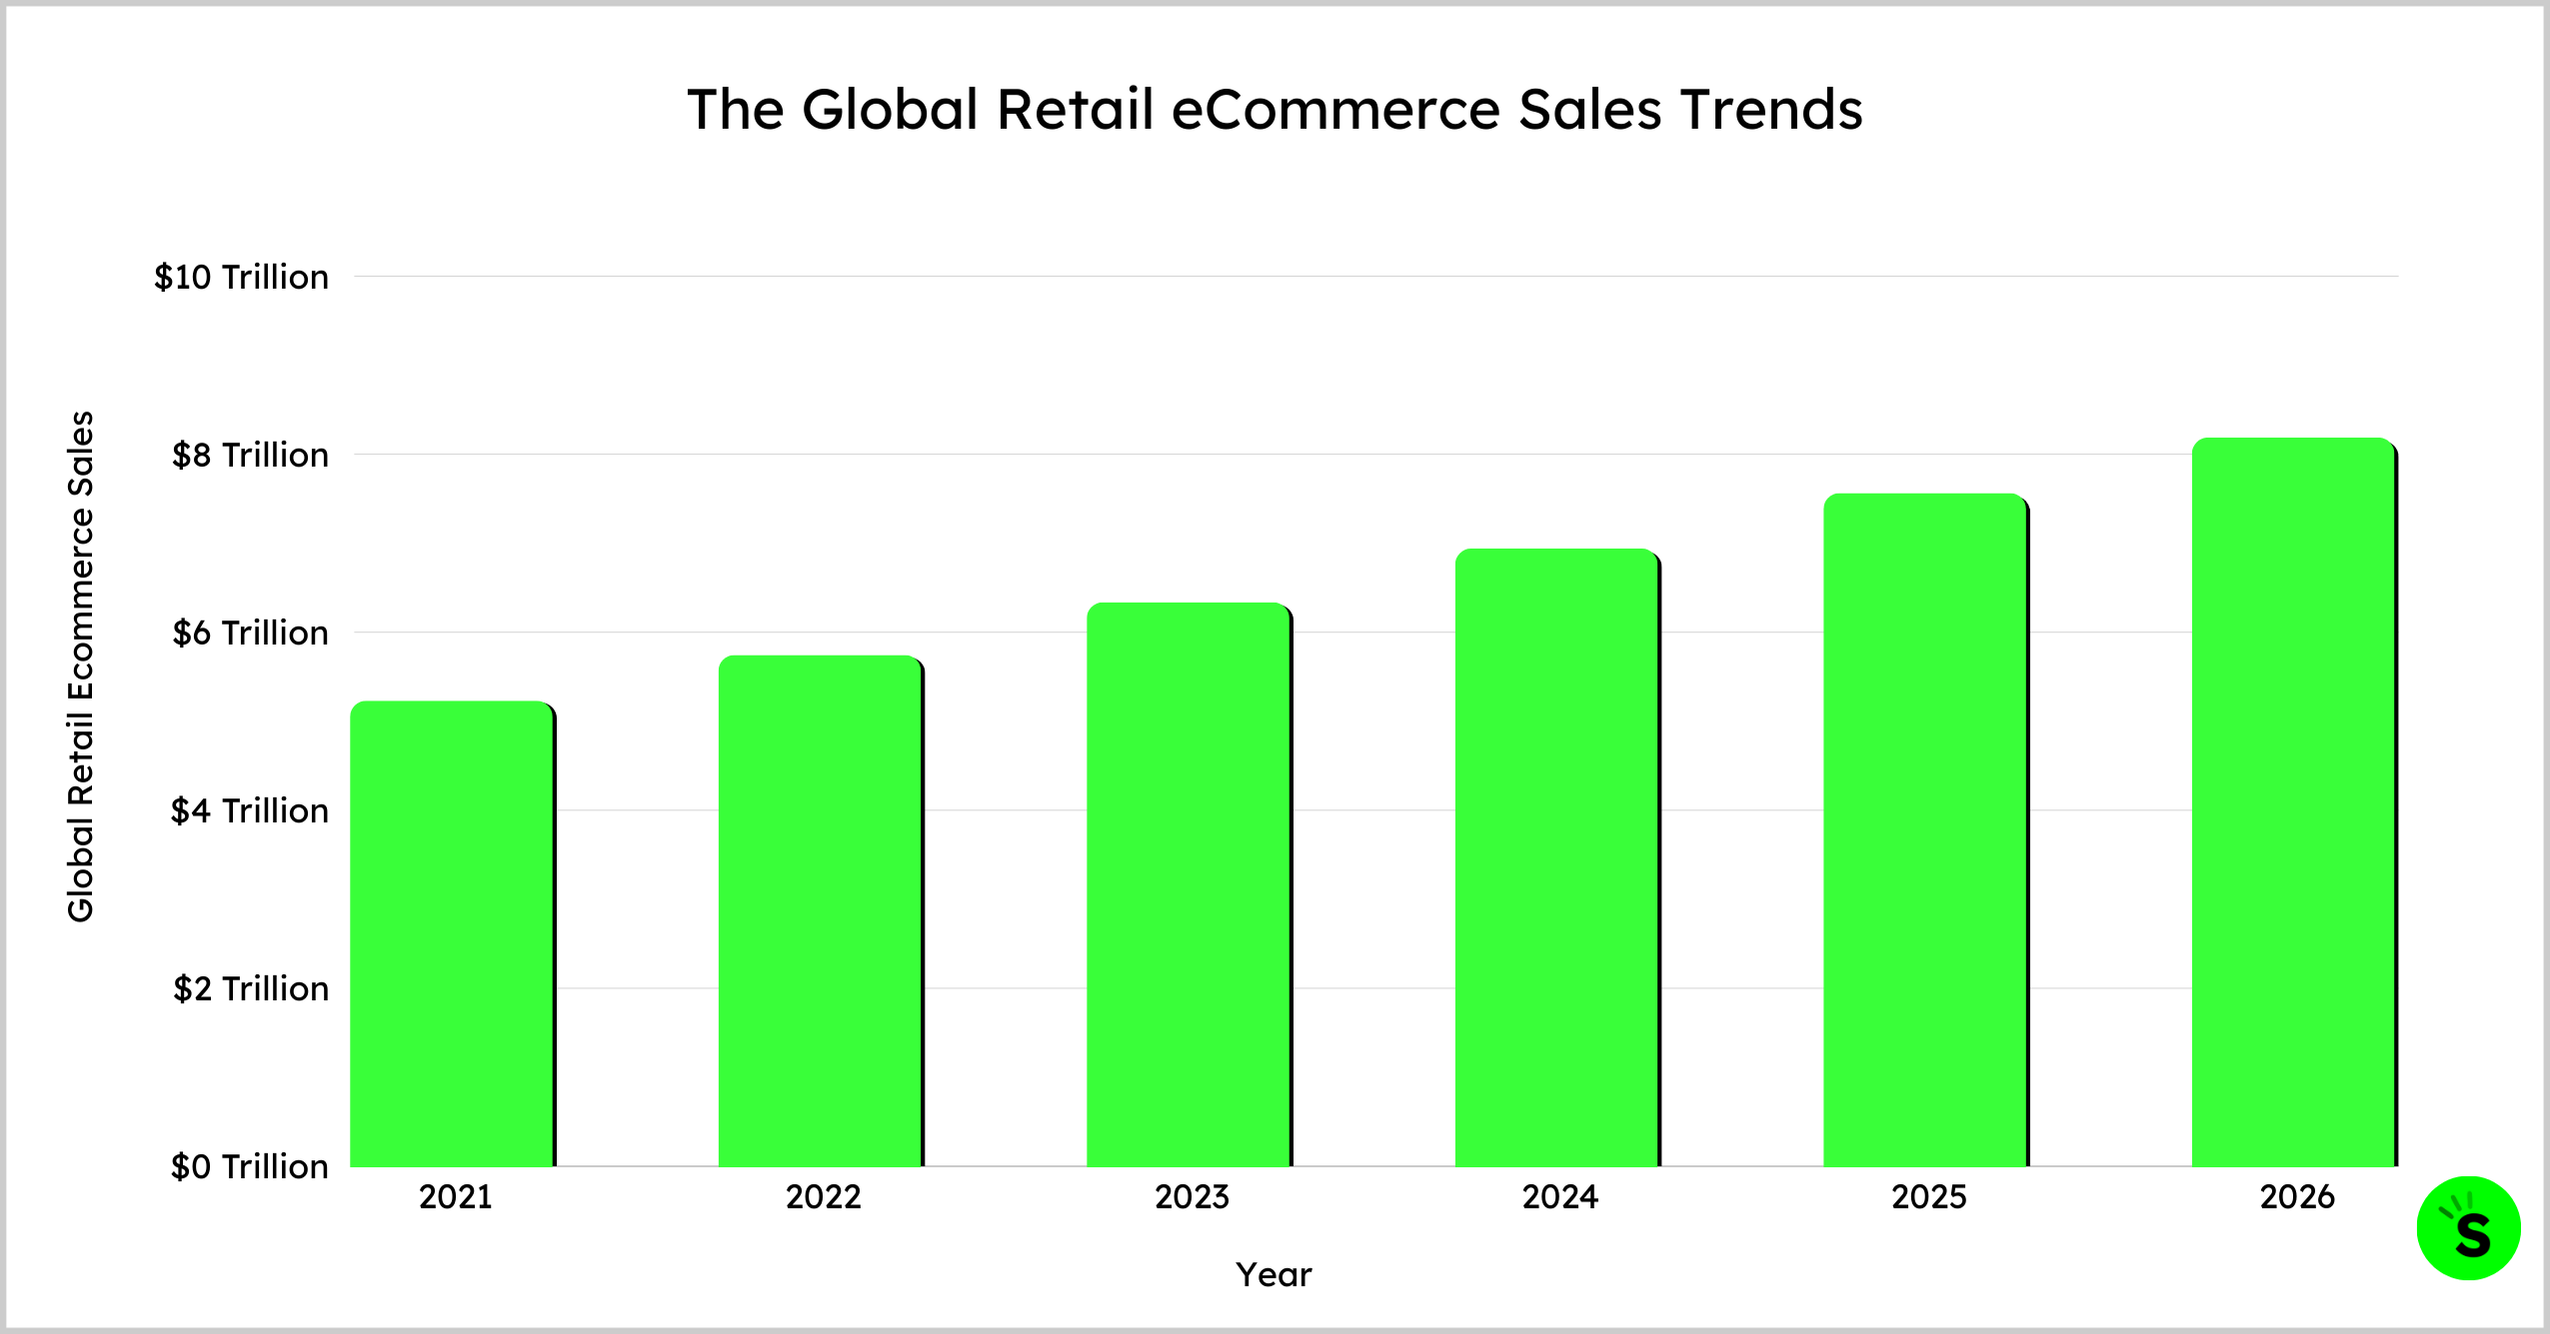
- Global retail ecommerce sales are projected to grow steadily from $5.211 trillion in 2021 to $8.148 trillion in 2026.

Here’s a detailed table summarizing the global retail ecommerce sales trends from 2021 to 2026
| Year | Global Retail Ecommerce Sales (in trillions) | Percentage of Total Retail Sales | Growth Rate |
|---|---|---|---|
| 2021 | $5.21 | 17.10% | 18.80% |
| 2022 | $5.72 | 19.70% | 9.70% |
| 2023 | $6.31 | 20.80% | 10.40% |
| 2024 | $6.91 | 21.90% | 9.60% |
| 2025 | $7.53 | 23.00% | 8.90% |
| 2026 | $8.15 | 24.00% | 8.20% |
Online Shopping Statistics By Country
- Americans are expected to spend an average of $875 per person on online shopping during the 2024 holiday season.
- People in the U.S. spent over 3 billion dollars every day in the first 8 months of 2024.
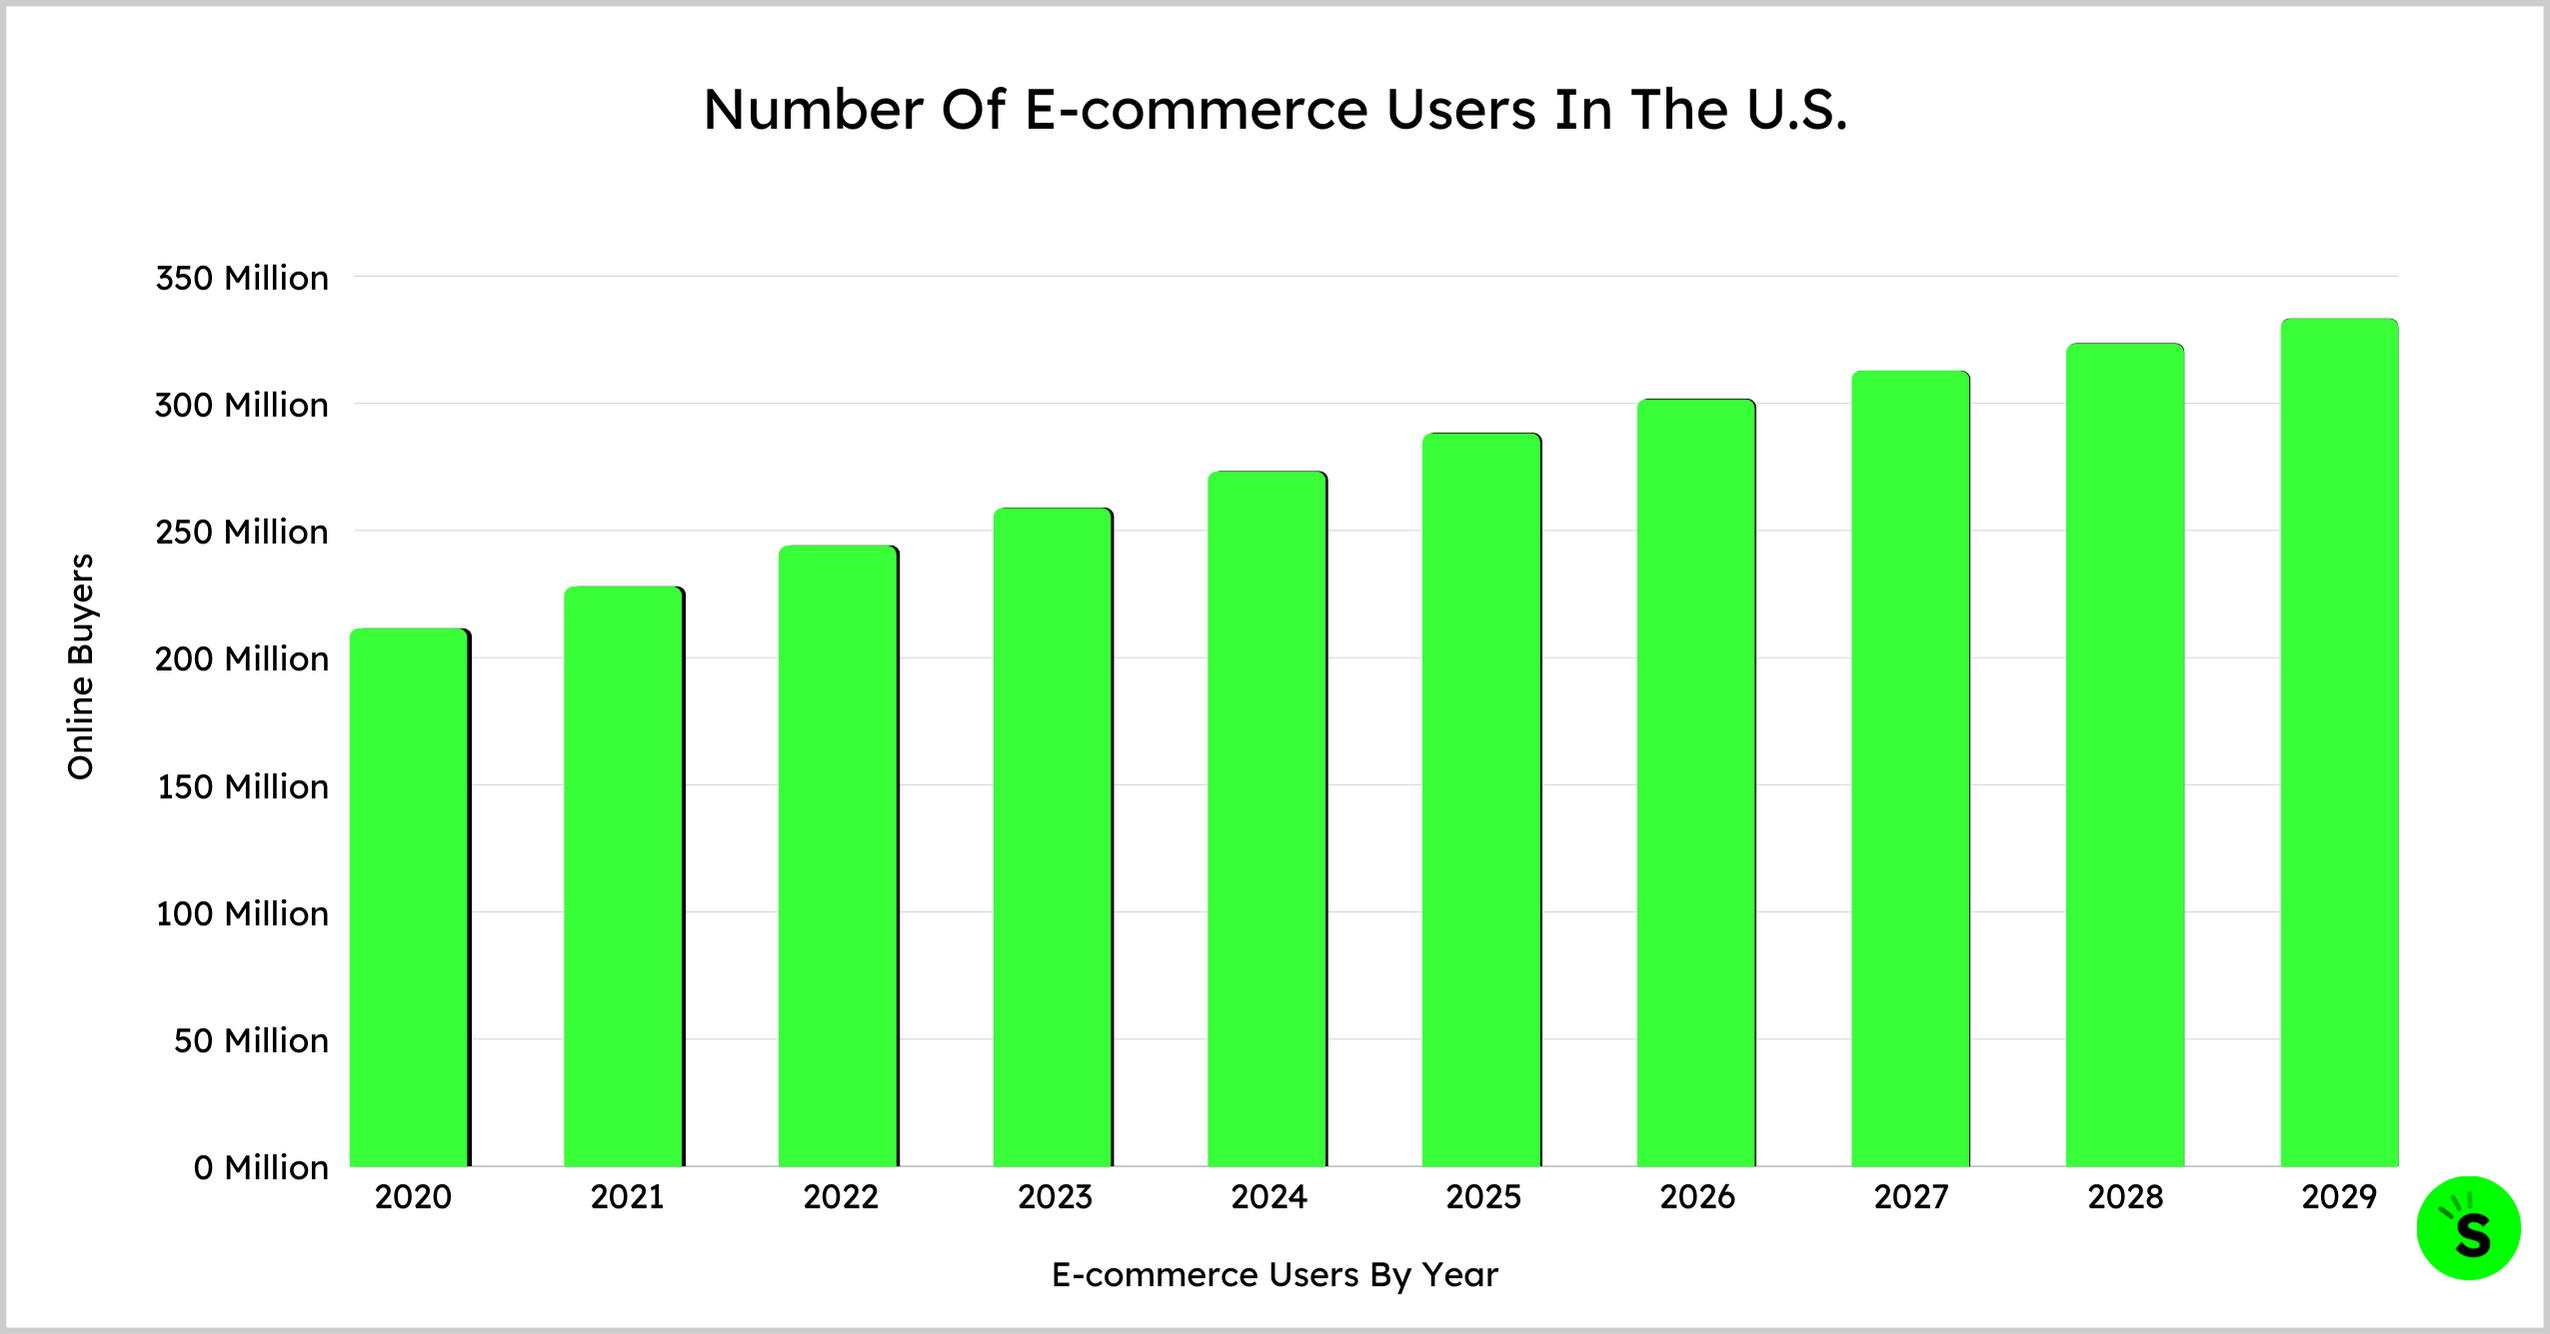
(Capital One Shopping Research) - Between 2024 and 2029, the number of e-commerce users in the U.S. is forecasted to increase by 60 million, a 21.94% increase.
This rise will lead to a projected peak of 333.5 million users in the US by 2029, marking the ninth consecutive year of growth in the e-commerce market.

The number of e-commerce users in the U.S. from 2020 to 2029 (in millions):
| E-commerce Users By Year | Online Buyers (in millions) |
|---|---|
| 2020 | 211.67 |
| 2021 | 228.19 |
| 2022 | 244.23 |
| 2023 | 259.06 |
| 2024 | 273.49 |
| 2025 | 288.45 |
| 2026 | 301.87 |
| 2027 | 313.01 |
| 2028 | 323.77 |
| 2029 | 333.5 |
(Statista)
- More Australian households are shopping online than ever, with 8 out of 10 making at least one online purchase in 2023. That’s 9.5 million households (+1.4% YoY) nationwide that received a parcel in 2023.
(Australian Online Shopping eCommerce Industry Report)
- As of February 2024, several countries showed remarkably high online shopping adoption rates:
- India, Indonesia, Vietnam, and the United Kingdom have the highest online shopping penetration rates, with 98% of their population shopping online.
China and the United Arab Emirates follow closely at 97%Netherlands, Switzerland, Spain, South Korea, Turkey, Saudi Arabia, and Italy all show 96% online shopping penetration.
(Statista)
- Denmark leads globally in terms of annual online spending per shopper at $3,426.47. Nearly 90% of Danish people aged 20-39 shop online. Their most popular purchases include shoes, clothes, garden supplies, and furniture.
The United States ranks second with $3,389.03 spent per shopper annually, with 92% of consumers shopping online. The 25-34 age group primarily focuses on electronics and fashion goods.
South Korea holds third place with $3,032 per shopper annually, where 96% of the population shops online. Food, beverages, and clothing are popular among the 20-40 age group, with many purchases made during their average 96-minute daily commutes.
The United Kingdom stands fourth, with an impressive 98% of consumers shopping online and average spending of $2,547 per person. The 25-34 age group predominantly purchases beauty products, fashion items, and electronics.
Australia ranks fifth, with 91% of consumers shopping online and an average spend of $2,189 per person. Like the UK, the 25-34 age group mainly purchases shoes and clothing.
Online Shopping Statistics By Age
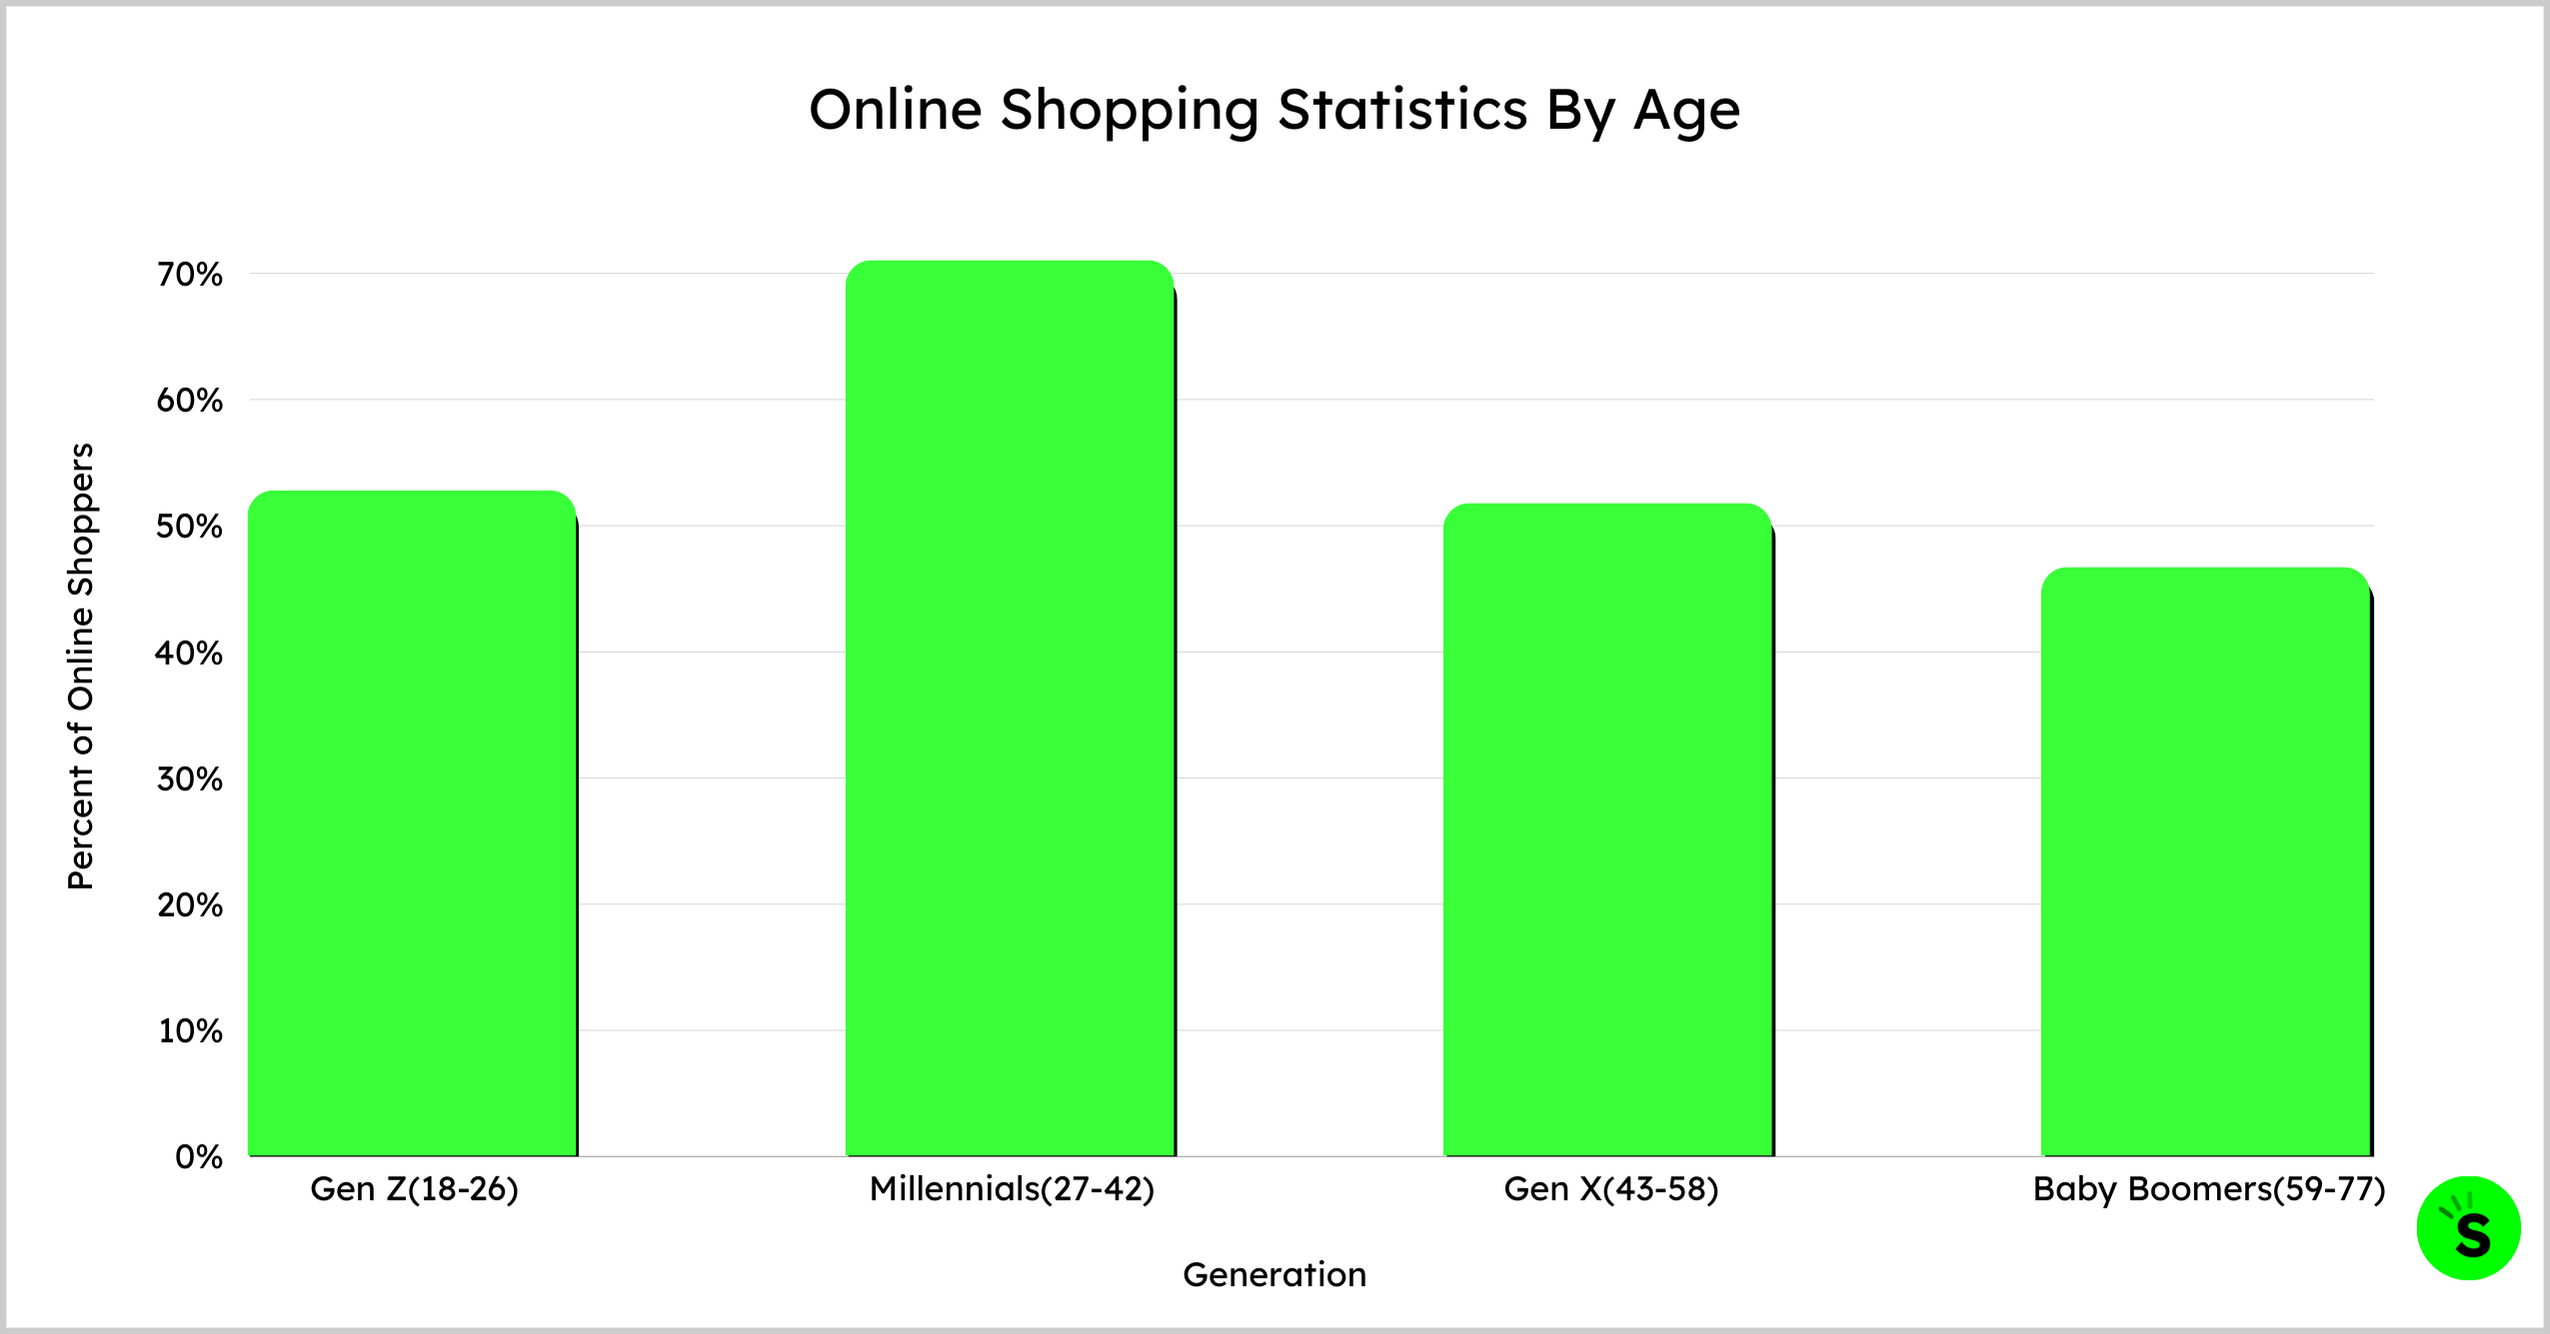
- Millennials (born between 1981 and 1996) are the most likely to shop online than any other age group. (Capital One Shopping Research)
Do not believe me? Take a look at the numbers:

- In the second quarter of 2023, the share of global shoppers who made a direct purchase from social media platforms varied by generational cohort:
| Generation | Age | Percent Of Online Shoppers |
|---|---|---|
| Gen Z | 18-26 | 52% |
| Millennials | 27-42 | 70% |
| Gen X | 43-58 | 51% |
| Baby Boomers | 59-77 | 46% |
(Statista)
However, this trend was very different during the pandemic
- On average, older consumers aged 43.194 were more likely to shop online than younger ones during Covid 19. (Cambridge)
In-Store Vs Online Shopping Statistics
- Online and non-store sales are expected to grow between 7% and 9% in 2024, reaching between $1.47 trillion and $1.50 trillion in the USA.
However, in 2024, Despite the growth in online sales, physical stores still account for approximately 70% of total retail sales.
(National Retail Federation)
- Employment in e-commerce has nearly tripled from 63,000 in 2010 to 165,000 in 2022.
This growth reflects the increasing importance of online shopping in the USA and the shift in consumer preferences towards e-commerce from in-store shopping.
Between 2010 and 2018, department store employment increased from 389,000 to 535,000, reflecting a solid retail sector.
In-store shopping saw a sharp decline of approximately 65% from its peak in 2018, with employment dropping to 189,000 by 2022, particularly during the pandemic.
(US Census Gov)
- During the pandemic, nearly 55% of consumers shopped online in June 2020, with 20% being first-time online grocery shoppers. The shift to online shopping was particularly pronounced among:
- Consumers concerned about COVID-19 (64.3% more likely to shop online)
- Those worried about food shortages (56.4% more likely to shop online)
(Cambridge)
Mobile Online Shopping Trends
- In 2023, approximately 30% of global internet users who made weekly purchases opted to do so via mobile phones, reflecting the growing reliance on mobile for shopping.
- Mobile commerce revenue is projected to reach approximately $2 trillion by 2024, indicating substantial growth in this segment.
- Mobile devices accounted for 66% of retail orders, underscoring their dominance in the online shopping landscape
- However, While mobile devices are favored for adding items to shopping carts, they exhibit lower conversion rates at checkout than desktops, where users generally feel more secure.
- Cart abandonment data from 2023 indicates that consumers, regardless of device, are more reluctant to purchase higher-priced and more personal products. Desktops consistently have the lowest abandonment rates across all product categories. (Statista)
- The relevance of mobile commerce varies by market:
In the UK, mobile shopping accounted for over half of all online retail sales globally in 2022.
In the Asia-Pacific region, South Korea led with mobile commerce, comprising about 75% of online sales, nearly double that of Japan.
(Statista)
- 44.4% of internet users in South Korea made weekly purchases via mobile phones—more than 5 times the percentage of users in Nigeria (7.6%) in 2023.
This table displays the Percentage of internet users worldwide in descending order who made weekly online purchases using a mobile phone by country as of the third quarter of 2023.
| Country | Percentage (%) |
|---|---|
| South Korea | 44.4% |
| Malaysia | 39.8% |
| UAE | 38.4% |
| Turkey | 38.4% |
| Taiwan | 36.3% |
| Greece | 35.3% |
| Mexico | 35.3% |
| United States | 35.2% |
| Singapore | 34.5% |
| Philippines | 33.9% |
| China | 33.7% |
| Indonesia | 33.3% |
| Poland | 32.6% |
| UK | 32.5% |
| Sweden | 32% |
| Ireland | 31.9% |
| Thailand | 31% |
| Chile | 30.6% |
| South Africa | 30.6% |
| Worldwide | 29.9% |
| Canada | 29.7% |
| Czechia | 29.6% |
| Russia | 29.5% |
| Hong Kong | 29% |
| Israel | 29% |
| Vietnam | 28.9% |
| Spain | 28.6% |
| Australia | 28% |
| Colombia | 27.2% |
| Portugal | 27.2% |
| Croatia | 26.7% |
| France | 26.4% |
| Romania | 26.4% |
| New Zealand | 26.2% |
| India | 26% |
| Saudi Arabia | 25.8% |
| Norway | 25.6% |
| Bulgaria | 25.3% |
| Germany | 24.4% |
| Italy | 24.2% |
| Switzerland | 22.3% |
| Austria | 22.3% |
| Argentina | 21.7% |
| Denmark | 21.6% |
| Belgium | 21.5% |
| Japan | 21.3% |
| Brazil | 21.1% |
| Netherlands | 21.1% |
| Hungary | 20.1% |
| Egypt | 17.8% |
| Kenya | 15.1% |
| Ghana | 11.2% |
| Morocco | 10.9% |
| Nigeria | 7.6% |
(Statista)
E-commerce Growth Statistic
- Turkey leads with a CAGR of 11.58%, making it the fastest-growing ecommerce market during this period.
Here is a table displaying the compound annual growth rate (CAGR) of retail e-commerce sales from 2024 to 2029 by country.
| Country | CAGR (2024-2029) |
|---|---|
| Turkey | 11.58% |
| Brazil | 11.56% |
| India | 11.45% |
| Mexico | 11.26% |
| Russia | 10.95% |
| Argentina | 10.55% |
| South Africa | 10.42% |
| China | 9.95% |
| Italy | 9.94% |
| Canada | 9.76% |
| Spain | 9.72% |
| Indonesia | 9.57% |
| Global | 9.49% |
| Australia | 9.36% |
| Japan | 9.23% |
| United States | 8.99% |
| Germany | 8.23% |
| France | 8.10% |
| United Kingdom | 7.80% |
| South Korea | 4.47% |
(Statista)
- Amazon’s market capitalization is approximately $1,961 billion, making it about 9.6 times larger than Alibaba, the second-largest e-commerce company with a market cap of $203.81 billion as of September 2024.
Let us take a look at the top E-commerce Companies by Market Cap worldwide (in billion U.S. dollars)
| Leading E-commerce Companies | Market Cap (in billion U.S. dollars) |
|---|---|
| Amazon (United States) | $1,961 |
| Alibaba (China) | $203.81 |
| Pinduoduo (China) | $136.62 |
| MercadoLibre (Argentina) | $105.15 |
| Meituan (China) | $99.79 |
| Shopify (Canada) | $96.17 |
| Copart (United States) | $48.8 |
| Sea (Singapore) | $46.13 |
| Coupang (South Korea) | $43.47 |
| Jingdong Mall (China) | $40.96 |
(Statista)
Online Shopping Revenue
- The average revenue per user (ARPU) in the U.S. e-commerce market in 2024 is estimated at $4,471.32
- The average revenue per user (ARPU) in the U.S. e-commerce market is projected to increase consistently from 2020 to 2029. Starting at $3,318.56 in 2020, it will grow to $5,639.15 by 2029, reflecting a significant rise over the decade.
Here’s a summary:
| Online Shopping Revenu By Year | Average Revenue Per User (USD) |
|---|---|
| 2020 | $3,318.56 |
| 2021 | $3,795.31 |
| 2022 | $3,864.84 |
| 2023 | $4,113.55 |
| 2024 | $4,471.32 |
| 2025 | $4,790.23 |
| 2026 | $5,103.56 |
| 2027 | $5,384.57 |
| 2028 | $5,547.52 |
| 2029 | $5,639.15 |
(Statista)

